The process of providing the complete report of an organization’s day to day activities, giving insights into operations on a regular, pre-defined basis is called Operational reporting. These reports extract data from multiple sources and generate insights at the desired frequency. As these reports serve various functions, they need to be customized for specific representation of data that allows stakeholders to interact with the reports and filter, deep dive to reach the desired details.
Often, Operational reporting is used by organizations to expedite their decision-making. This allows them to get a holistic picture and make long term informed strategic decisions. Operational reporting provides real-time granular level insights for fast-paced industries. These reports include data regarding ongoing processes, expenses, revenue, production, accounting, and more. However, it is important to note that the focus remains on providing short-term insights as well.
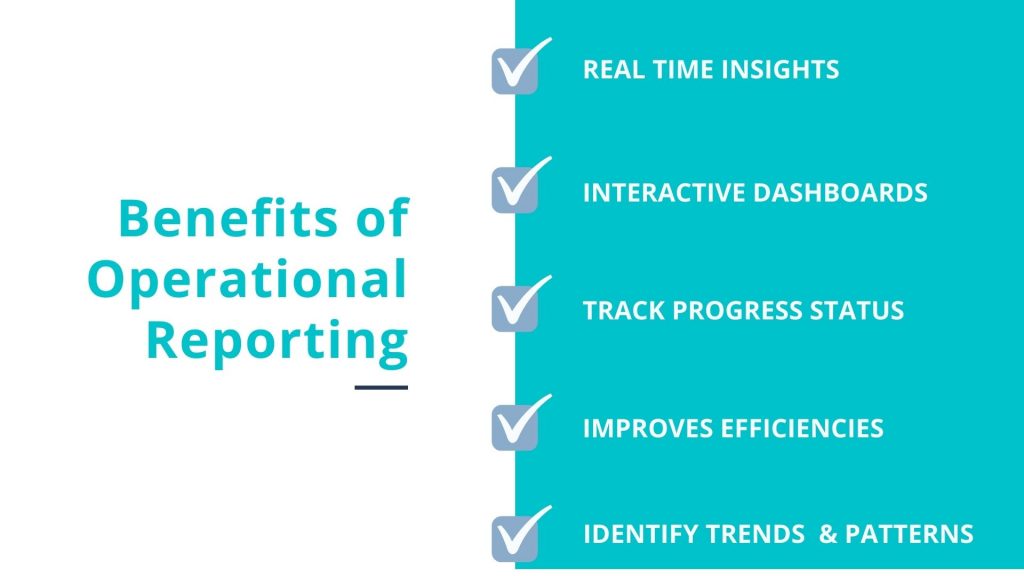
Benefits of Operational Reporting

- Provides real time insights
- Interactive dashboards that help in expediting decision making
- Enables organizations to track progress at all levels of operations
- Improves efficiencies in various departments, and save time and money
- Empowers leaders by identifying trends and patterns and strategizing accordingly, while executives can improve upon their day to day work to enhance productivity.
Types of Operational Reporting

As the name suggests, real-time or live operational reports provide operational data analytics and insights for the modern fast-paced industries. Executives and Managers access the real-time reports in the form of dynamic dashboards with numbers, trends, and statistics to track changes as they happen. They can observe the data and make informed and proactive data-driven decisions in the short term and strategize for the long term actions. This provides business a dynamic pace of work, makes them adaptive, agile and responsive, improving overall performance.
Monthly operational reporting helps keep track of the progress of essential activities on a monthly basis. These reports and dashboards provide insights about the month on month trends and updates, organization’s progress, and department-wise performance. It provides a holistic view of the operations, aiding in making short term decisions and includes long term strategic initiatives. A typical monthly operational report provides a balanced view of the organization, consisting of essential metrics and KPIs along with a detailed view of attributes
The need for data-driven operational reports and dashboards is industry agnostic. These reports help measure progress, track the goal completion, enhance customer satisfaction, and improve overall operational efficiencies. For example, financial operational reports provide an overall view of the institution’s finance as well as provide a combination of important KPIs. These metrics can be drilled down to the lowest levels to know minor details like daily performance. These dashboards can also provide an eagle eye’s view of the complete operations to assess the success and find anomalies to improve upon.
Examples of Operational Reporting
Operational reporting has proven value across industries and domains. Below are a few examples of how different industries use it in different ways:
- Operational reporting is used in the manufacturing industry to monitor the complete production line, reduce machine downtimes and measure individual employee efficiency. They can also forecast raw material needs, optimize production rate, analyze defect rates, save time, and reduce operational costs.
- In the retail industry, operational reporting helps identify and establish market and product trends and strategize the product line. The retailers track the individual store business, keep stock of inventory to know which products to replenish and observe which brands and products are doing better, and which are not. Stores can recognize loyal customers, monitor the sales growth against benchmarks, and know the most lucrative customer segment. These insights allow retailers to optimize productivity, manage the supply chain effectively, and ultimately improve sales.
- Marketing and advertising use these reports to measure and track campaign progress, improve performance and identify which channel is performing better than the others. They can know metrics such as the average number of leads, the average impressions vs conversions, the number of leads, their quality, and engagement, improve CPC, and generate better ROI.
- Operational reporting is used in the IT Industry to monitor goals, track project status, and compare between ideal, available, actual & billed hours. This enables the PMO to analyze revenue leakages, project overheads, and revenue distribution for clients, business units and products, monitor the timeline compliance and resource allocation.
- The supply chain vertical uses operational reporting to track and quantify its performance. Managers monitor the inventory-to-sales ratio, see inventory turnover trends over a specific duration, number of units per transaction, perfect order and backorder rate, and measure inventory accuracy.
Here is how we at Cintel.io can help you:
As the organizations keep growing and expanding, the significance of these operational reports increases. These provide a time to time picture of the entire organization or division and help the leaders track their performance. Be it any industry or domain, operational reporting is imperative to stay on top of all the processes and get a concise yet complete view. With the emergence and wide acceptance of BI, operational reporting is bound to make positive change across the hierarchy and horizontally too.
The operational reports need to be self-explanatory with minimalistic structure with an intuitive flow. The stakeholders can draw the desired insights quickly and navigate seamlessly. The dashboards must follow the top to bottom approach in terms of KPIs and begin with the most critical KPIs being reported first, and gradually moving to the next level of insights like trends and patterns there by giving a holistic view. In case the report is serving more than one group or has shared interest, a separate dashboard or functions like filter, sort, and more should be provided.
Our operational reports convey a data story that is important to understand the goals and audience. We understand that the selection of the right KPIs is critical and that they need to be revisited on a periodic basis. We provide a balanced mix of metrics that will help the leaders in identifying the areas that need attention and the ones that need to be tracked regularly.